Difference between revisions of "Homer GUI"
Jump to navigation
Jump to search
| Line 22: | Line 22: | ||
<br clear="all" /> | <br clear="all" /> | ||
| + | |||
* A completed '''Homer''' panel may look something like this... | * A completed '''Homer''' panel may look something like this... | ||
| Line 31: | Line 32: | ||
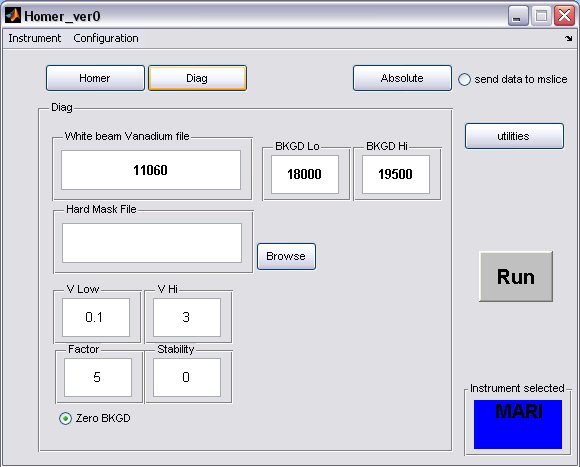
* click on the '''Diag''' button to bring up the Diag panel | * click on the '''Diag''' button to bring up the Diag panel | ||
| + | |||
[[image:fig7.jpg|left]] | [[image:fig7.jpg|left]] | ||
| Line 36: | Line 38: | ||
* b) the background limits can also be changed, if you have selected to perform a flat background subtraction on the homer panel, then these are the limits which will be used | * b) the background limits can also be changed, if you have selected to perform a flat background subtraction on the homer panel, then these are the limits which will be used | ||
<br clear="all" /> | <br clear="all" /> | ||
| + | |||
* A completed '''Diag''' panel may look something like this... | * A completed '''Diag''' panel may look something like this... | ||
| + | |||
[[image:fig5.jpg|left]] | [[image:fig5.jpg|left]] | ||
<br clear="all" /> | <br clear="all" /> | ||
| + | |||
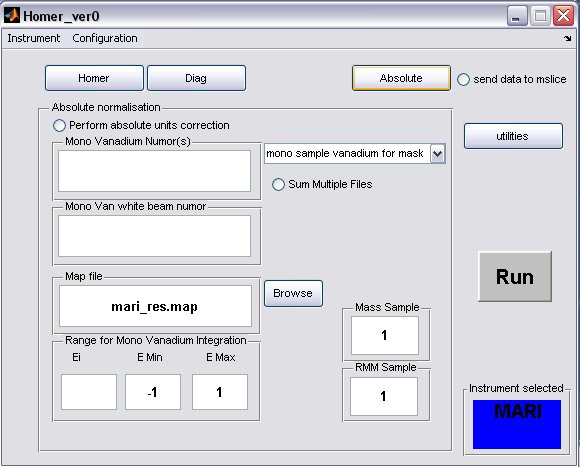
* click on the '''Absolute''' button to bring up the Absolute Normalisation panel, absolute normalisation is '''not''' selected to be performed by default | * click on the '''Absolute''' button to bring up the Absolute Normalisation panel, absolute normalisation is '''not''' selected to be performed by default | ||
| + | |||
[[image:fig8.jpg|left]] | [[image:fig8.jpg|left]] | ||
| Line 50: | Line 56: | ||
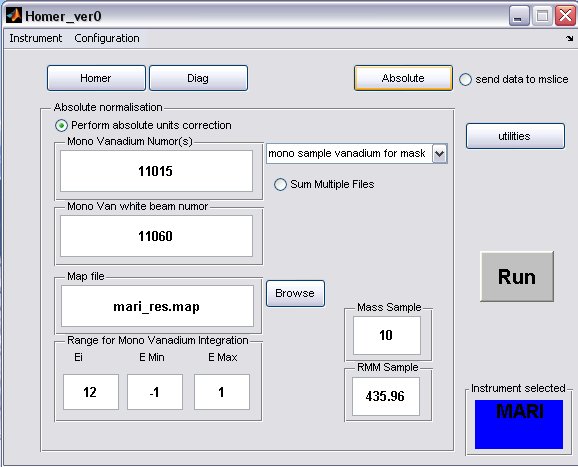
* c) select the radiobutton to perform the normalistion | * c) select the radiobutton to perform the normalistion | ||
<br clear="all" /> | <br clear="all" /> | ||
| + | |||
* A completed '''Diag''' panel may look something like this... | * A completed '''Diag''' panel may look something like this... | ||
| + | |||
[[image:fig6.jpg|left]] | [[image:fig6.jpg|left]] | ||
<br clear="all" /> | <br clear="all" /> | ||
Revision as of 13:15, 7 February 2008
- Before running the HOMER GUI make sure that you have read the Instructions to setup LIBISIS and setup the GUI, and acted on them
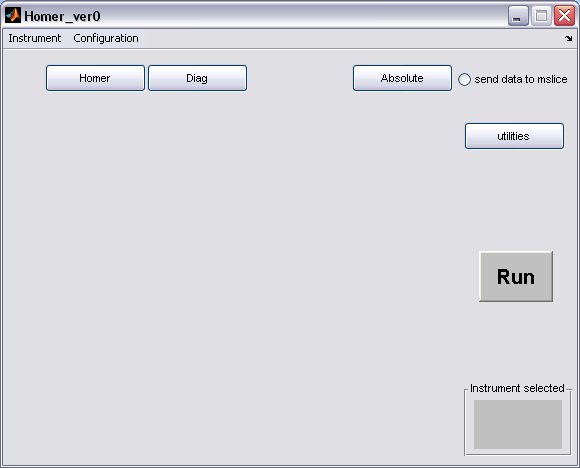
- Homer will start from the matlab command line to bring up a GUI window
>> Homer_ver0

select your instrument using the drop-down menu, this will create the instrument defaults which were defined in the Homer Gui setup

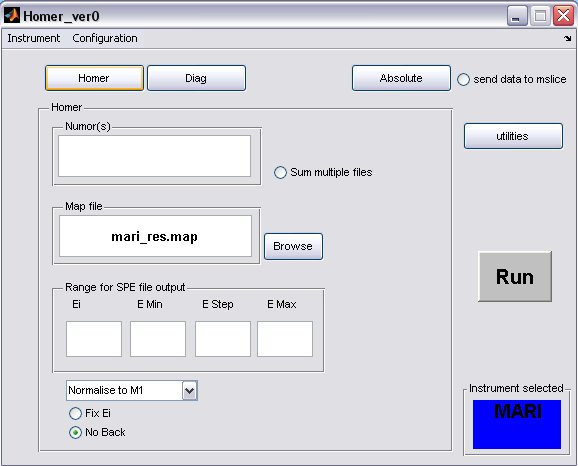
- click on the Homer button to bring up the homer panel

- a) The default map file for the instrument will be filled in, but you can select another one or one you have created using the Map File Format, provided you have placed it in the map file directory.
- b) Fill in energy values for the SPE file output
- c) The Ei will be determined from the run unless the Fix Ei radiobutton is selected
- d) If you want to subtract a flat background from the data then unselect the No Back radiobutton
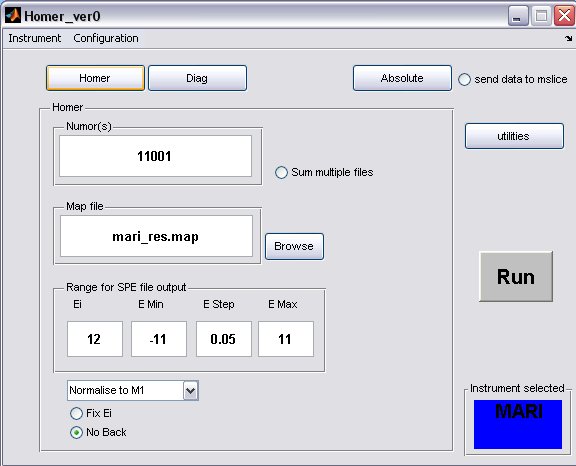
- A completed Homer panel may look something like this...

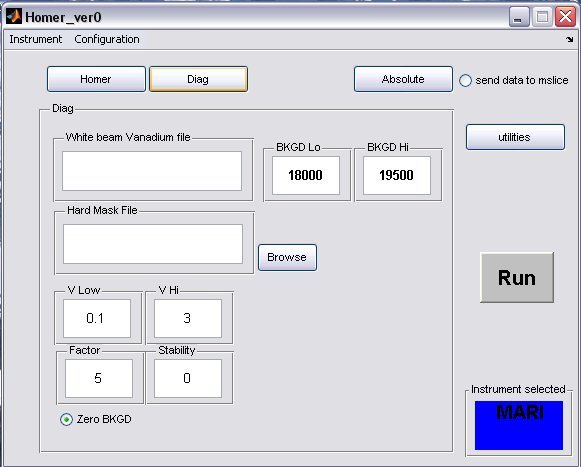
- click on the Diag button to bring up the Diag panel

- a) fill in the white beam run numor, and optionally select a hard mask (if there is one for your instrument)
- b) the background limits can also be changed, if you have selected to perform a flat background subtraction on the homer panel, then these are the limits which will be used
- A completed Diag panel may look something like this...

- click on the Absolute button to bring up the Absolute Normalisation panel, absolute normalisation is not selected to be performed by default

- a) Generally the Mono Van white beam numor will be the same as the sample white beam numor, but in special cases for pre PCICP MAPS experiments a diffferent wiring was used for these runs, in this case select the appropriate drop-down menu
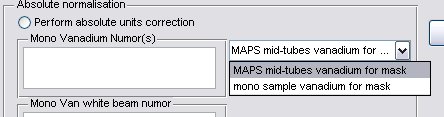 , and select a different map file.
 - b) fill in appropriate Sample Mass, Sample RMM and Ei, which will be calculated.
- c) select the radiobutton to perform the normalistion

- A completed Diag panel may look something like this...
