Plot Commands
The main purpose of the graphics package is to plot graphs. Several different commands exist to facilitate this.
One Dimensional Plots
Plot Types
Images of the one dimensional plot types can be seen here.
| Command | Plot Type |
|---|---|
| dl | Line Plot |
| dm | Marker Plot |
| de | Errorbar Plot |
| dh | Histogram Plot |
| dp | Marker with Errorbars Plot |
| dp | Marker and Lin with Errorbars Plot |
Syntax:
>> dh(w, 'property', value, 'property2', value2,...)
where w is a dataset and 'property' and value define property-value pairs. See the functions for a list of properties that can be set.
Overplots
If an overplot command is used, then the next plot will appear on top of the plot in the relevant plot window.
| Command | Plot Type |
|---|---|
| pl | Overplot Line |
| pm | Overplot Marker |
| pe | Overplot Errorbar |
| ph | Overplot Histogram |
| pp | Overplot Marker with Errorbars |
| pp | Overplot Marker and Line with Errorbars |
Plotting Arrays of IXTdataset_1d
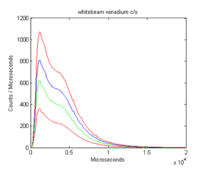
If a one dimensional plot command is given an array of IXTdataset_1d objects then each IXTdataset_1d will be plotted as an overplot. Their order in the array is the same as the plotting order so that
>> dl(w, optional)
is the same as
for i = 1:length(ww)
    pl(w(i), optional)
end
EXAMPLE:
If w is a 4 element array of IXTdataset_1d objects then
>> acolor('red', 'blue', 'green')
>> dl(w)
Gives the following result
Plotting Arrays of IXTdataset_2d
When a one dimensional plot is made of an IXTdataset_2d object then the IXTdataset_2d object is expanded into an array of IXTdataset_1d objects and then plotted.
Two Dimensional Plots
Plot Types
Images of the two dimensional plot types can be seen here.
| Command | Plot Type |
|---|---|
| da | Area Plot |
| ds | Surface Plot |
| mp | Multiplot Plot |
Syntax:
>> ds(ww, 'property', value, 'property2', value2,...)
where w is a dataset and 'property' and value define property-value pairs. See the functions for a list of properties that can be set.
